
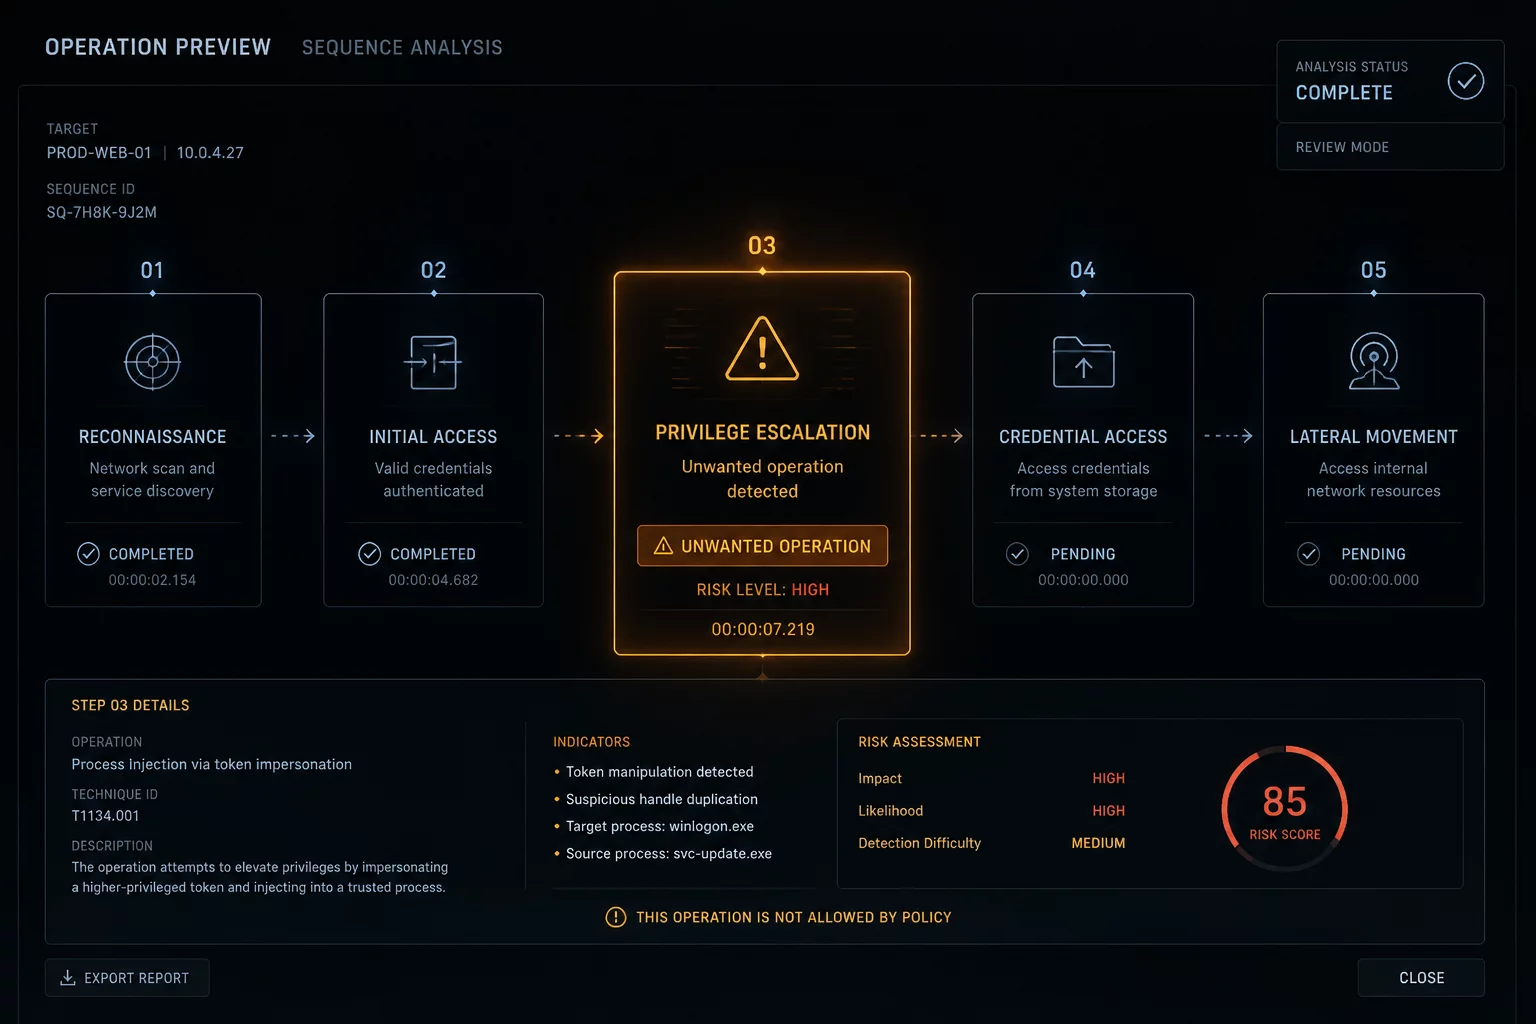
Simulation Window Diagnostics
The final preview window in CAM software acts as an exact digital twin of physical gantry movement. When scrubbing the playback slider, every rapid traverse, raster scan, and vector stroke reveals the literal gcode instructions queued for execution.
Detecting an unintended burn during preview saves costly stock from ruin. Operators often spot unexplained traversals across finished faces or dense fill operations where only a subtle surface mark was planned. Recognizing these anomalies before pressing start eliminates scrap completely.
Three Causes of Ghost Runs
Unwanted operations typically originate from subtle layer misconfigurations or unclosed vector geometry transferred during DXF or SVG import.
- Unclosed geometry triggering full flood-fill rastering instead of thin line tracing.
- Hidden CAD construction lines retained on active output layers rather than dedicated tool layers.
- Duplicate vectors stacked exactly on top of each other causing redundant high-heat cut passes.
Isolating layers one by one in the preview pane instantly exposes which specific color assignment introduces the rogue toolpath. Once identified, toggle the layer output switch or reassign geometry to non-processing guide layers.
Pre-Flight Isolation Routine
Always execute a full scrub of the time slider with rapid moves toggled visible. Look closely for diagonal transit lines that fire the beam across parts, and verify that the estimated job duration matches anticipated process benchmarks.